How it works
From performance debt to a clear next step.
Connect your systems, rank the daily cost and track what changes after a fix.
Connect the systems you run.
An agent on each machine discovers services and reads access logs and database statistics. The infrastructure map shows connections; coverage checks identify sources that still need configuration. See how coverage works.
Duration × frequency = cumulative cost.
For a query, 40 milliseconds multiplied by 90,000 executions is 3,600 seconds of query execution per day. Per-day rates use the observed period. These totals describe accumulated time, not elapsed wall-clock time or guaranteed financial savings; overlapping work should not be interpreted as separate customer waiting time.
One list
Everything slow on one scale, ordered by what it costs you
Endpoints, queries, PHP stalls, queued jobs and scheduled commands, all priced the same way. Use the daily cost to compare priorities across the application.
Every cost counted once
One request seen by nginx and by OpenTelemetry is one request. One statement reported by
your ORM and by its driver is one statement. One query seen by the application and by
performance_schema is one query. Slowpoke removes the duplicates
instead of adding them up, otherwise nobody would trust the totals.
Down to the line of code
With a framework package, every query points at the line that ran it, like
OrderController.php:42. Never at a file inside
vendor/, node_modules/ or
site-packages/.
Background work counts too
A queued job nobody watches and a nightly command that overlaps the backup cost real time on real machines. They sit in the same list as your slowest endpoint, priced the same way.
Query doctor
Real EXPLAIN plans, in plain language
The agent runs EXPLAIN next to your database, in a read-only
transaction, and only on statements it has already seen on that machine. The server never
chooses the SQL. It reports what it found in words a tired engineer can act on at 6pm.
Full table scans
With the exact index to add and the row count before and after it: 1.2M rows read to return 20, then 24 rows read to return 20.
N+1 queries
The route that triggers them, how many times per request, and the line of code that runs them in a loop.
The quiet ones
A number compared with a text column, so the index is never used. A
LIKE '%abc' that can only scan. An OFFSET
48,000. The query plan helps explain why they are slow.
Twelve named diagnoses, each with the fix it suggests
MySQL 5.7 and 8, MariaDB, and PostgreSQL. Statements stored without their values still get a plan on PostgreSQL 16 and newer, using a generic plan.
Verify the result after the work ships.
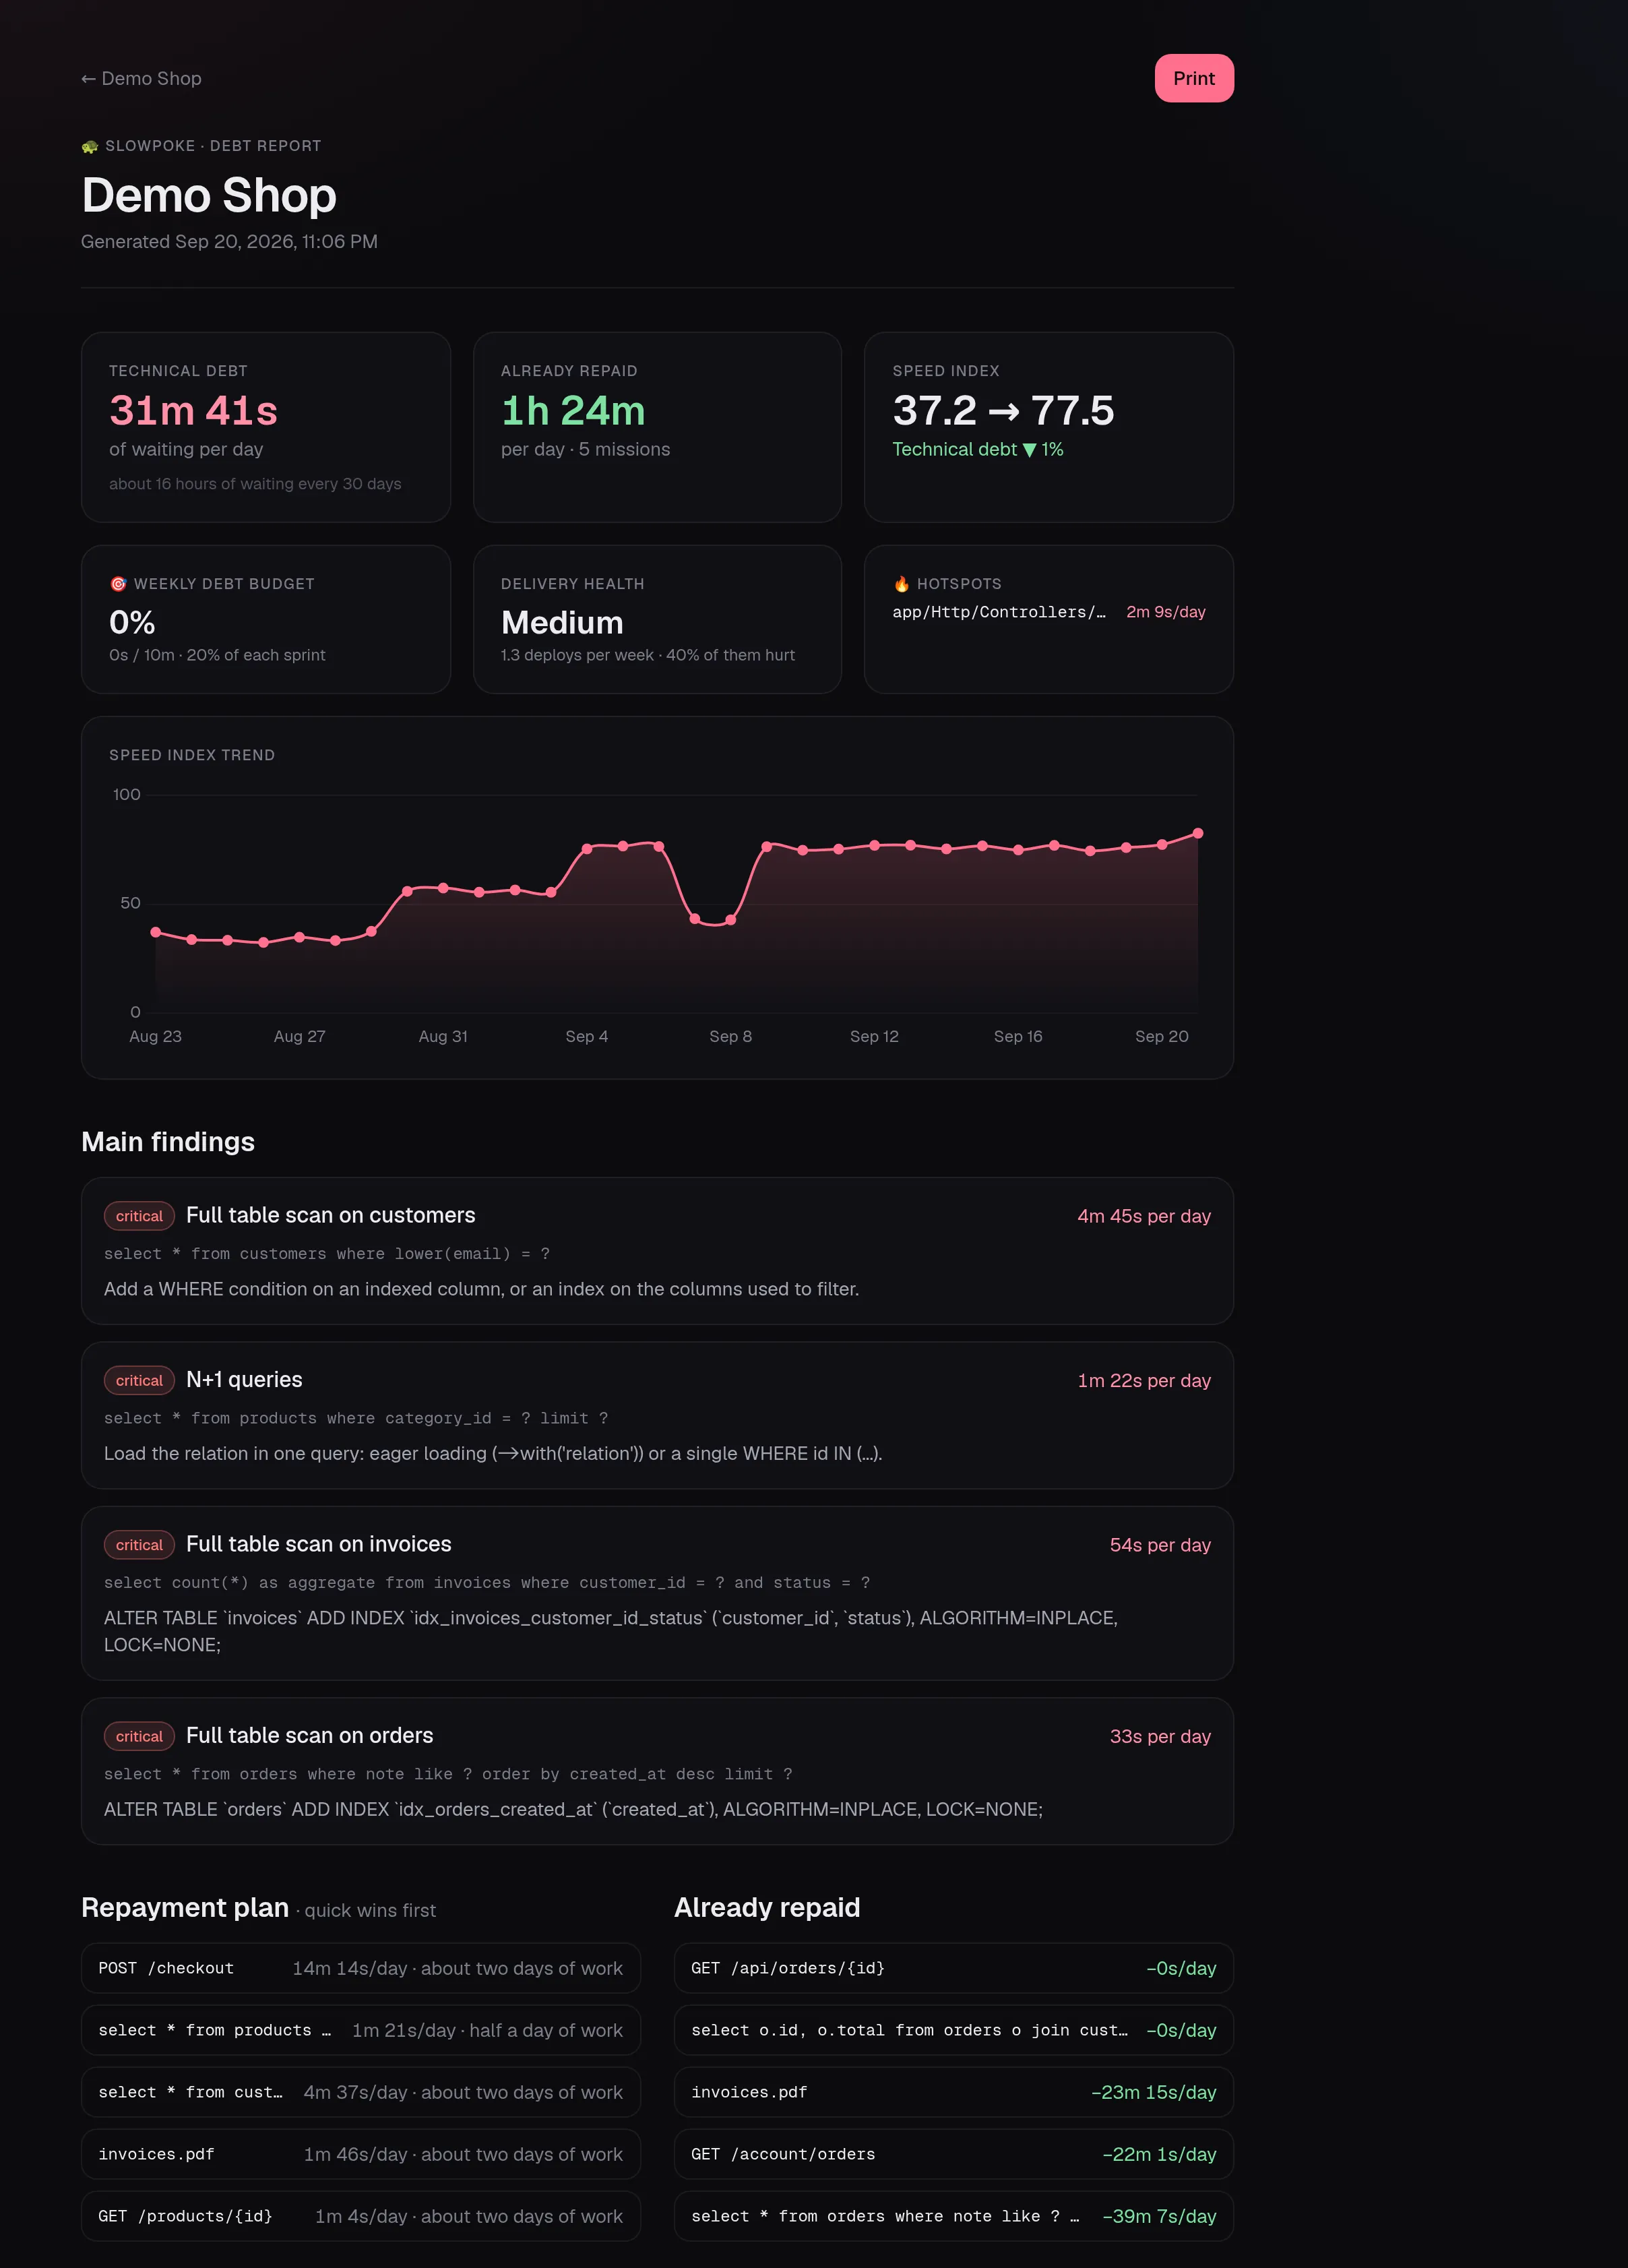
The most costly issues become missions with an owner and a target. A mission closes when its cost stays down across consecutive measurement windows. Check the history alongside traffic: lower usage can also reduce daily cost. Regressions are linked to deploys so the team can investigate.
Make the case for the work
A report the wider business can follow.
Share the daily debt, completed missions and effort estimates. Use the evidence to explain why a performance task deserves a place in the next sprint.
Sample project shown; your results depend on your workload.